Walmart Sales (2011-2014) Data: Interactive Dashboard
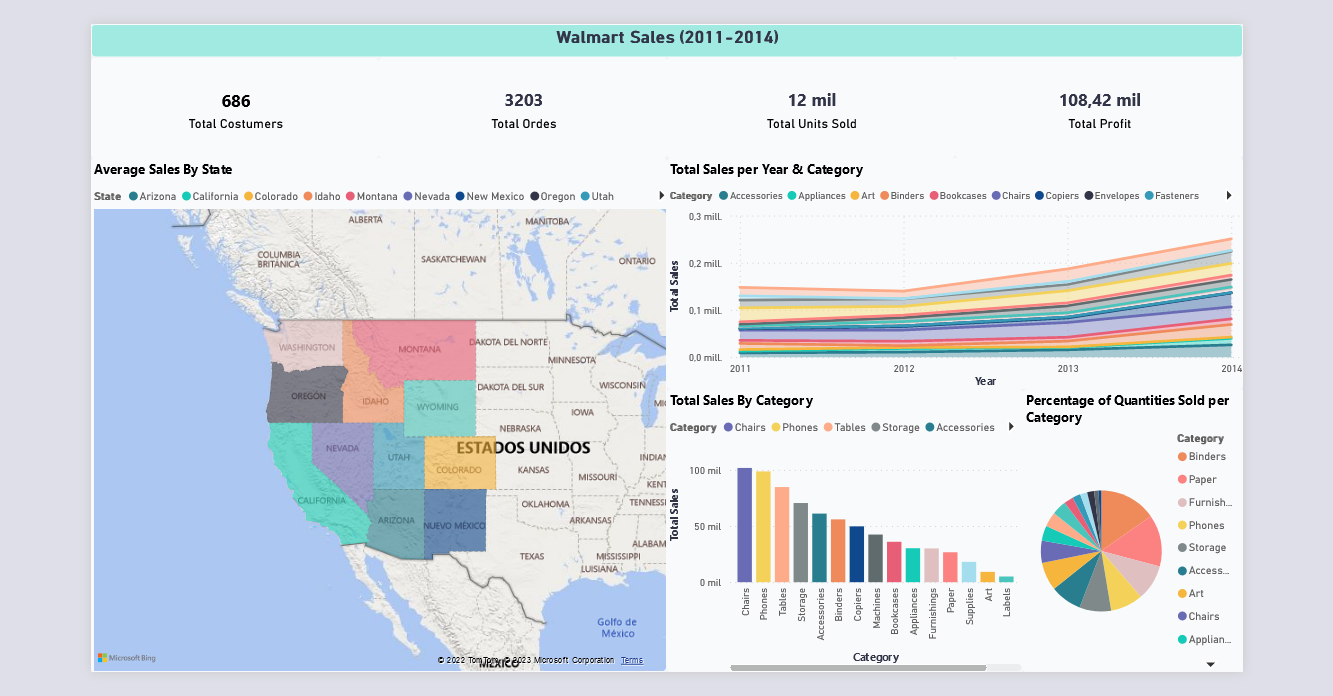
In this Power BI project, Walmart sales data from 2011 to 2014 was analyzed to build an interactive dashboard.
The data included order IDs, customers, categories sold, quantity of items sold, profit, and sales for each product.
Overall, the dashboard provided valuable insights into sales trends and customer behavior for Walmart during the specified time period.
BI Tool(s): Power BI.
Database Source: Walmart Sales
Project Source: Power BI File Project
Full Visual: Walmart Sales (2011-2014)